Adobe Scout is Adobe’s most excellent profiler for Flash (web and AIR) content. Although it’s a somewhat recent application, it has easily become my go-to tool for measuring and optimizing performance of Flash content. It’s truly an invaluable resource for doing things like detecting memory leaks and performance hiccups, and something that should be used by all kinds of ActionScript developers (although game developers will probably benefit the most from it).
Teaching anyone how to use Scout is out of the scope of this post; Thibault Imbert does that and more in this article anyway. What I’d like to share is the list of steps one needs to take to use Scout to profile content running on the OUYA. While this tool on pretty well support on Android, the steps are not as trivial on the microconsole. But I was curious about some information I could only get through the use of Scout (maximum GPU memory consumption), so I had to get it working soon. Here it goes.
- Install Adobe Scout (you may need Adobe Creative Cloud, and a Creative Cloud account).
- Download the installation file (APK) for the companion Android app for Scout. This is not as trivial as it sounds, since the OUYA doesn’t have access to Google Play and there’s no link to the APK file. You will probably need to download it to an standard Android device and “backup” it so the APK is stored somewhere accessible (more information here). Hopefully Adobe will make this available publicly in the future.
- Install the APK to your OUYA. If you have the Android SDK installed, you can connect your OUYA to your PC using a micro USB cable, get it to be recognized as a USB device, and use ADB to install the file using the command line (
adb install -r filename.apk); if you don’t, you can host the file somewhere else on the web and point the OUYA browser to it. The former is recommended, however, since you also need it to be able to test OUYA games directly from your PC without much hassle. - Run Adobe Scout on your machine.
- Run Adobe Scout on the OUYA (under the “Make” menu) and enter your PC IP (apparently it should list your computer automatically, although it didn’t happen to me). Your OUYA has to be on the same network as your computer. You will get a message stating whether it was able to connect or not, and the list of features it’ll profile (CPU, ActionScript, etc).
- Run your game normally from your PC with the OUYA as the target, as you would while testing/debugging. Be sure to have the telemetry option on for the compiler (
--advanced-telemetry=true). - Switch to the Scout window on your PC and you will see the data coming in. Strangely, it takes a while for the data to start streaming in (it is sent with some delay), but the information it contains seems to be accurate.
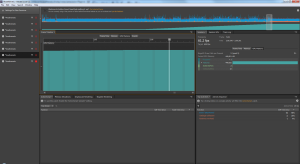
Here’s an example of an OUYA debugging session with Scout, an unoptimized version of my game prototype with an intentional GPU memory leak; you can see the memory usage increase triggered after 60 seconds:
To answer my original question: I was able to allocate 449,851 kilobytes of data on the OUYA’s GPU memory, as BGRA textures. This was done by testing in increments of 96kb, and I got the exact same number 3 times, so it’s probably fairly accurate. Ironically, it’s more than what my PC can do – I was only able to push it to 404mb.
Lastly, I had some bad luck running my game in debug mode – my game would crash sooner than expected while testing maximum memory usage. This is probably because of the added overhead; both debug mode and the telemetry switch debug execution performance, so be sure to compile a correct SWF before release, or to test a release version while doing Scout profiling (this is also recommended by the application itself).

